As we all know market moves in phases
What are those phases?
A primary bull or bear trend consists of two phases, specifically
Accumulation phase: if the market rises after consolidating, we say that the consolidation represents accumulation (buying activity).
Distribution phase: if the market declines after consolidating, we say that the consolidation represents distribution (selling activity)
The main issue arises when a trader tries to know whether this consolidation is accumulation or distribution.
So how can we overcome that issue?
As a trader, we have to try to look for evidence that suggests whether accumulation or distribution is taking place during consolidation and out of that evidence we will discuss how we can use chart patterns to identify the phase.
Chart patterns belong to one of two groups, that is, reversal or continuation.
Chart patterns have intrinsic and extrinsic biases.
What is the intrinsic bias of chart patterns?
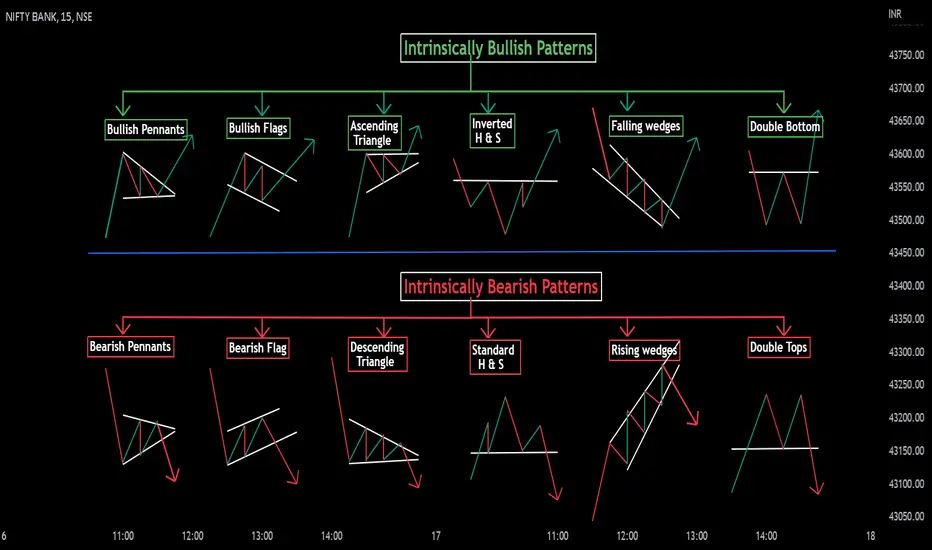
Intrinsic bias means the inherent bullish or bearish sentiment associated with a chart pattern.
For example,1. An ascending triangle pattern has an inherently bullish bias.
2. A head and shoulder pattern has an inherently bearish bias.
3. A descending triangle pattern has an inherently bearish bias.
## A symmetrical triangle and rectangle /horizontal range pattern have an intrinsically neutral bias
What is the extrinsic bias of chart patterns?
Extrinsic bias refers to as location-based sentiment of a chart pattern.
Like a pattern forming at some location which is historically a strong resistance zone (Market top) so if an ascending triangle forms at that location then its extrinsic bias will be bearish .
Example 1: An descending triangle is an intrinsically bearish pattern , but if it is forming at a strong support location then the extrinsic bias will be bullish .
Example 2: An ascending triangle is intrinsically bullish , that is, it has a bullish bias. Regardless of where this pattern occurs with respect to past price action, it will always be inherently a bullish indication, but If this bullish pattern is found at the price level of some historically significant market top/Resistance, then we say that it is extrinsically bearish , cause the pattern is located at a significant resistance.
Factors determining the extrinsic bias of the pattern
• Direction of the preceding trend.
• Location with respect to historical extremes in price.
• Location with respect to the phase of an underlying market cycle
• Location with respect to other support and resistance barriers to price.
• Bullish or bearish divergent formations.
How can we use this extrinsic and intrinsic bias?
When extrinsic bias and intrinsic bias both are in agreement then the possibility of a reversal at market tops or bottoms is significant.
Similarly, for trends, when the intrinsic bias of the chart pattern is in agreement with the directionality of the trend, i.e., the trend sentiment, the potential for a continuation is usually greater.
For example, The inverse head and shoulder pattern have an intrinsically bullish bias, and it is also forming at a strong support location then its extrinsic bias is also bullish .
##When attempting to determine the reliability of potential reversals during the accumulation and distribution phases, or continuations during the trend phase, it is important to look for agreement between the intrinsic and extrinsic biases. If Any disagreement is seen as an indication that a reversal or continuation may be inherently weak.
##Intrinsically neutral formations, their extrinsic bias or sentiment is derived from the trend sentiment. For example, a symmetrical triangle will adopt an extrinsically bullish bias in an uptrend and an extrinsically bearish bias in a downtrend.
By considering these Factors while trading chart patterns in different market phases will give an in-depth insight and helps in making more informed and rational decisions.
I hope you found this helpful.
Please like and comment.
Keep Learning,
Learn and Trade Share Market, Forex and Crypto with Pattern
Views:


0 comments:
Post a Comment